
ICP
  • About
    • ICP for Programs, Financiers, and Green Banks >
      • GHG Accounting
      • Adaptive Reuse
      • Certification Timing
      • Post-Cert Changes
    • How Does ICP Work? >
      • Project Framework
      • Roadmap to IREE Certification
    • GGRF EPA Reporter
    • Tech Forum >
      • Technical Forum Blog
      • Discussion Notes
      • Call Recordings
      • Reference Documents
      • Glossary
      • Acronyms
      • Protocol Archives
    • ICP in Canada
    • Contact Us
  • Training
  • IREE Certification
    • Guide to IREE Certification
    • Commercial Protocols >
      • Large Commercial
      • Standard Commercial
      • Targeted Commercial
      • Basic / Performance
    • Multifamily Protocols >
      • Large Multifamily
      • Standard Multifamily
      • Targeted Multifamily
      • Basic / Performance
    • Project Development Specification
    • Project Registration >
      • Performance Update
    • Tools and Templates >
      • Cx, O&M, M&V Templates
      • QA Checklists
      • Building Button
    • Case Studies
  • Providers
    • Project Developer Network >
      • Join the ICP PD Network
    • Quality Assurance Assessors >
      • Join ICP's Quality Assurance Asserssors
  • Blog
    • Blog
    • ICP In the News

NYC Releases Report on Benchmarking Data - 2 Billion Sq. Ft. Served

9/27/2013

Comments

 
Picture
Recently, the second annual report was released analyzing New York City benchmarking data collected for calendar year 2011 from 13,258 properties encompassing 24,071 buildings, constituting more than two billion square feet of real estate. Representing a compliance rate with the ordinance of 75 percent. 

New York City Local Law 84, part of the Greener, Greater Buildings Plan, requires all privately-owned properties with individual buildings more than 50,000 square feet (sq ft) and properties with multiple buildings with a combined gross floor area more than 100,000 sq ft to annually measure and submit their energy and water use data to the City. 

PictureClick to Enlarge
One of the key observation from the report is that the median ENERGY STAR score increased to 67 from 64. This increase in the relative efficiency of buildings in year two of NYC’s benchmarking effort, could have to do with either different characteristics of the building stock, or the impacts of benchmarking on behavior or even owners taking proactive measures to improve their scores. While the report does not seem to take a position on the cause of this improvement in the score, the potential for disclosed scores to drive energy efficiency in the competitive commercial building sector represents one of the key outcomes of benchmarking, and should warrant continued study.
Picture
Picture
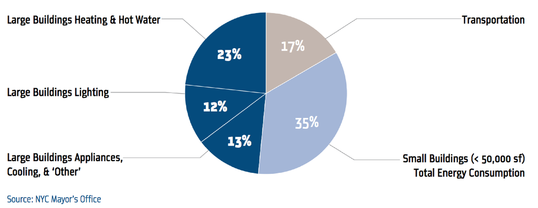
There were also some key takeaways related to the NYC building stock, including:
  • Retail uses showed the widest range in energy utilization intensities with the highest users consuming five times more than the lowest users when measured on a per area basis. 
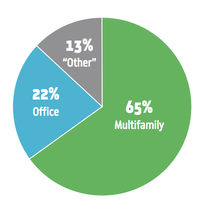
  • The multifamily sector was the largest share of benchmarked buildings, and showed the narrowest variation in energy consumption between the most and least intensive users. 
  • The most intensive water consumption was observed in multifamily properties. 

This report is a great first step toward a world where there is transparency in the real-estate markets into energy performance as a driver of asset value, rental rates, and other key metrics. We are looking at the tip of the iceberg and the possibilities are termendous.

Download the complete report.

Comments

Connecting Building Benchmarking to Energy Efficiency Investors

8/26/2013

Comments

 
Picture Click to Enlarge
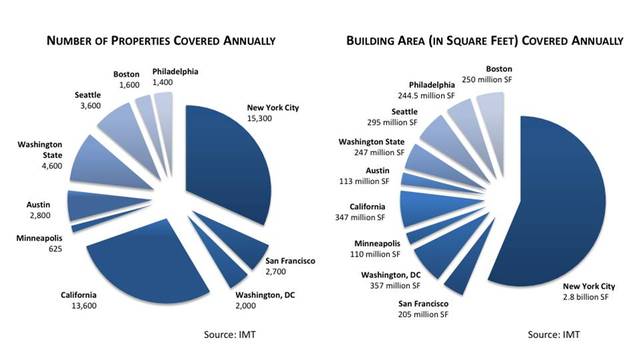
With over four billion square feet already covered under building benchmarking ordnances in major cities across the country, chances are, if you are thinking about energy efficiency policy and program design, you are taking notice.  

Building benchmarking refers to the rating of the relative energy efficiency of a building compared to its peers, and in many cases also includes making this information known to consumers. The mechanism aims to raise consumer awareness about energy performance and encourage building energy improvements through greater market transparency.

Benchmarking initiatives are growing in popularity and early results seem to support that there is a significant positive impact on demand for energy efficiency upgrades.  

In 2012, an EPA analysis of 35,000 benchmarked buildings around the U.S. found that benchmarked buildings experienced, on average, 2.4% energy savings annually. Buildings that benchmarked for three years running saw an average energy savings of 7% during that same period. A 2012 report by the Georgia Tech Ivan Allen College School of Public Policy found that energy benchmarking in commercial properties could reduce national energy consumption by 5.6 percent in 2035. Another 2012 report, commissioned by the California Public Utilities Commission, found that benchmarking was highly correlated with building energy improvements and management actions, and was a strong catalyst for customer participation in utility clean energy rebate and incentive programs.

The Investor Confidence Project (ICP) supports benchmarking initiatives as critical to helping establish a linkage between energy performance and asset value, tenancy rates, rent levels and other key values of importance to building owners and tenants alike. Additionally, promoting transparency within energy performance puts pressure on building owners to ensure their buildings are competitive compared with their peers.

Generating demand for energy efficiency upgrades is the fundamental barrier in the market and benchmarking is a primary strategy to overcome this obstacle.  However, there remains a critical need once a project has been developed to connect it with necessary investors in a form that enables underwriting and pooling of projects into understood asset classes.

The Investor Confidence Project’s Role in Building Energy Benchmarking

The ICP supports benchmarking programs by helping to create a roadmap from energy efficiency project development to the necessary array of investors and capital sources.  The ICP Energy Performance Protocols (ICP Protocols) come into play once a building owner is ready to move forward with a specific energy efficiency project, providing a next step once a benchmarking program has helped establish demand.

Once a building owner has undergone a benchmarking and is ready to move forward with an actual upgrade to improve a building’s efficiency score as a way to improve cash-flow, the ICP establishes a pathway to develop a project in a form that enables a transparent market and reduces underwriting and engineering costs for investors. It is a common misunderstanding that there is not enough capital available. In reality, the true barrier is the lack of deal-flow.  And the deals that do emerge are often apples and oranges, rather than apples to apples. Standardization will allow investors to more easily pool projects into large enough funds for senior capital investors, and will dramatically reduce costs associated with technical vetting and performance underwriting.

As the ICP Protocols begin to standardize benchmarking programs, they will help establish a single marketplace for commercial energy efficiency projects that will encourage investment and bring down the cost of capital.  With more participation and standardization, this market will grow the bigger and become more attractive to clean energy investors.

We believe that there is great value for benchmarking programs to adopt the ICP Protocols as a standard approach to project requirements. This will help enable a nationwide market with sufficient scale to attract the array of investors and capital needed to realize energy efficiency’s full potential.  This single market of similar projects makes attracting investors to energy efficiency substantially easier, and is a win-win for programs and building owners.

If you would like to learn how you can leverage the ICP protocols in your program, or for your projects, please become a project ally, and help us accelerate investment in energy efficiency.

Picture
Comments

    RSS Feed

    Archives

    April 2025
    November 2024
    May 2024
    July 2023
    July 2021
    June 2019
    March 2019
    March 2018
    January 2018
    December 2017
    October 2017
    August 2017
    January 2017
    December 2016
    October 2016
    August 2016
    July 2016
    June 2016
    April 2016
    March 2016
    February 2016
    January 2016
    December 2015
    November 2015
    October 2015
    September 2015
    August 2015
    July 2015
    June 2015
    April 2015
    March 2015
    February 2015
    December 2014
    November 2014
    October 2014
    September 2014
    July 2014
    June 2014
    May 2014
    April 2014
    March 2014
    February 2014
    January 2014
    December 2013
    November 2013
    October 2013
    September 2013
    August 2013
    July 2013
    June 2013
    May 2013
    March 2013
    January 2013
    December 2012
    October 2012

    Categories

    All
    179d
    25e
    Ab758
    Benchmarking
    California Energy Commission
    Carbon Credit
    Cec
    Credentialing
    Edf
    Eepp
    Energy Software
    Femp
    Icp
    Insurance
    Leasing
    Low Income Weatherization
    Measurement And Verification
    M&V
    Pace
    Performance
    Ppa
    Risk Management
    Software
    Software Providers
    Solar
    Tax Credits
    Ump
    Uniform Methods Project
    Wap

Contact the Project