

Recently, the second annual report was released analyzing New York City benchmarking data collected for calendar year 2011 from 13,258 properties encompassing 24,071 buildings, constituting more than two billion square feet of real estate. Representing a compliance rate with the ordinance of 75 percent.
New York City Local Law 84, part of the Greener, Greater Buildings Plan, requires all privately-owned properties with individual buildings more than 50,000 square feet (sq ft) and properties with multiple buildings with a combined gross floor area more than 100,000 sq ft to annually measure and submit their energy and water use data to the City.
New York City Local Law 84, part of the Greener, Greater Buildings Plan, requires all privately-owned properties with individual buildings more than 50,000 square feet (sq ft) and properties with multiple buildings with a combined gross floor area more than 100,000 sq ft to annually measure and submit their energy and water use data to the City.
 Click to Enlarge
 One of the key observation from the report is that the median ENERGY STAR score increased to 67 from 64. This increase in the relative efficiency of buildings in year two of NYC’s benchmarking effort, could have to do with either different characteristics of the building stock, or the impacts of benchmarking on behavior or even owners taking proactive measures to improve their scores. While the report does not seem to take a position on the cause of this improvement in the score, the potential for disclosed scores to drive energy efficiency in the competitive commercial building sector represents one of the key outcomes of benchmarking, and should warrant continued study.
There were also some key takeaways related to the NYC building stock, including:
This report is a great first step toward a world where there is transparency in the real-estate markets into energy performance as a driver of asset value, rental rates, and other key metrics. We are looking at the tip of the iceberg and the possibilities are termendous.
Download the complete report.
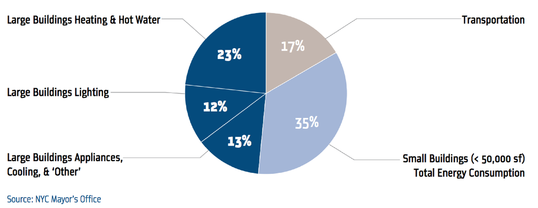
- Retail uses showed the widest range in energy utilization intensities with the highest users consuming five times more than the lowest users when measured on a per area basis.
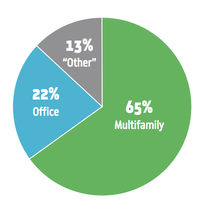
- The multifamily sector was the largest share of benchmarked buildings, and showed the narrowest variation in energy consumption between the most and least intensive users.
- The most intensive water consumption was observed in multifamily properties.
This report is a great first step toward a world where there is transparency in the real-estate markets into energy performance as a driver of asset value, rental rates, and other key metrics. We are looking at the tip of the iceberg and the possibilities are termendous.
Download the complete report.
 RSS Feed